For my dissertation project, I looked into how attention to elections changes the way you think about political leaders and the government. The basic idea: the more you pay attention to partisan conflict (like an election), the more your attitudes are influenced by partisan bias. But in order to test my hypotheses statistically I needed a way to measure how attention to politics changes over time. To look at the 2004 and 2008 elections, I settled on Google search data.
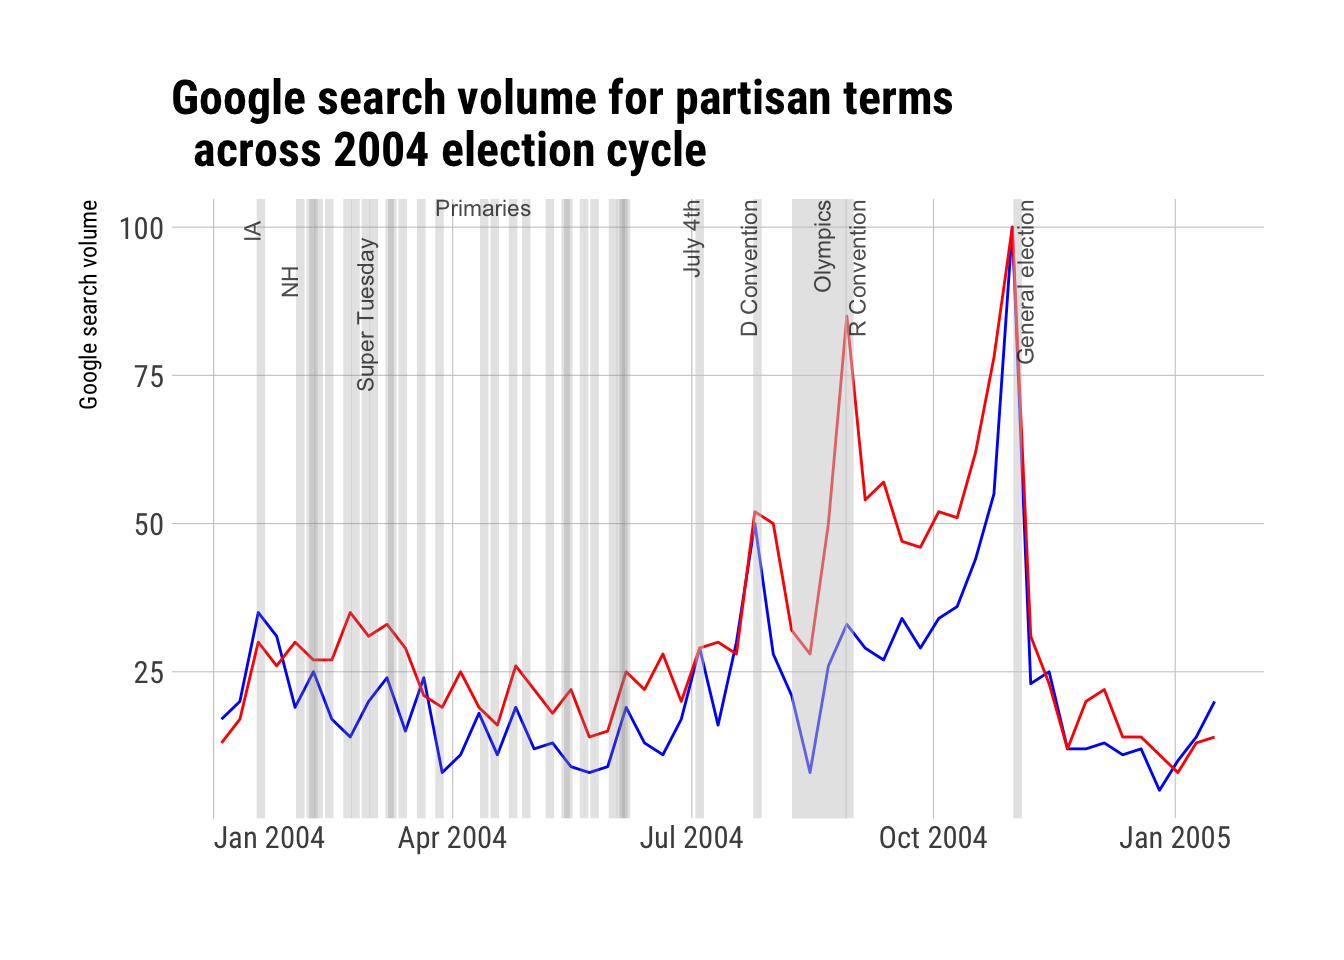
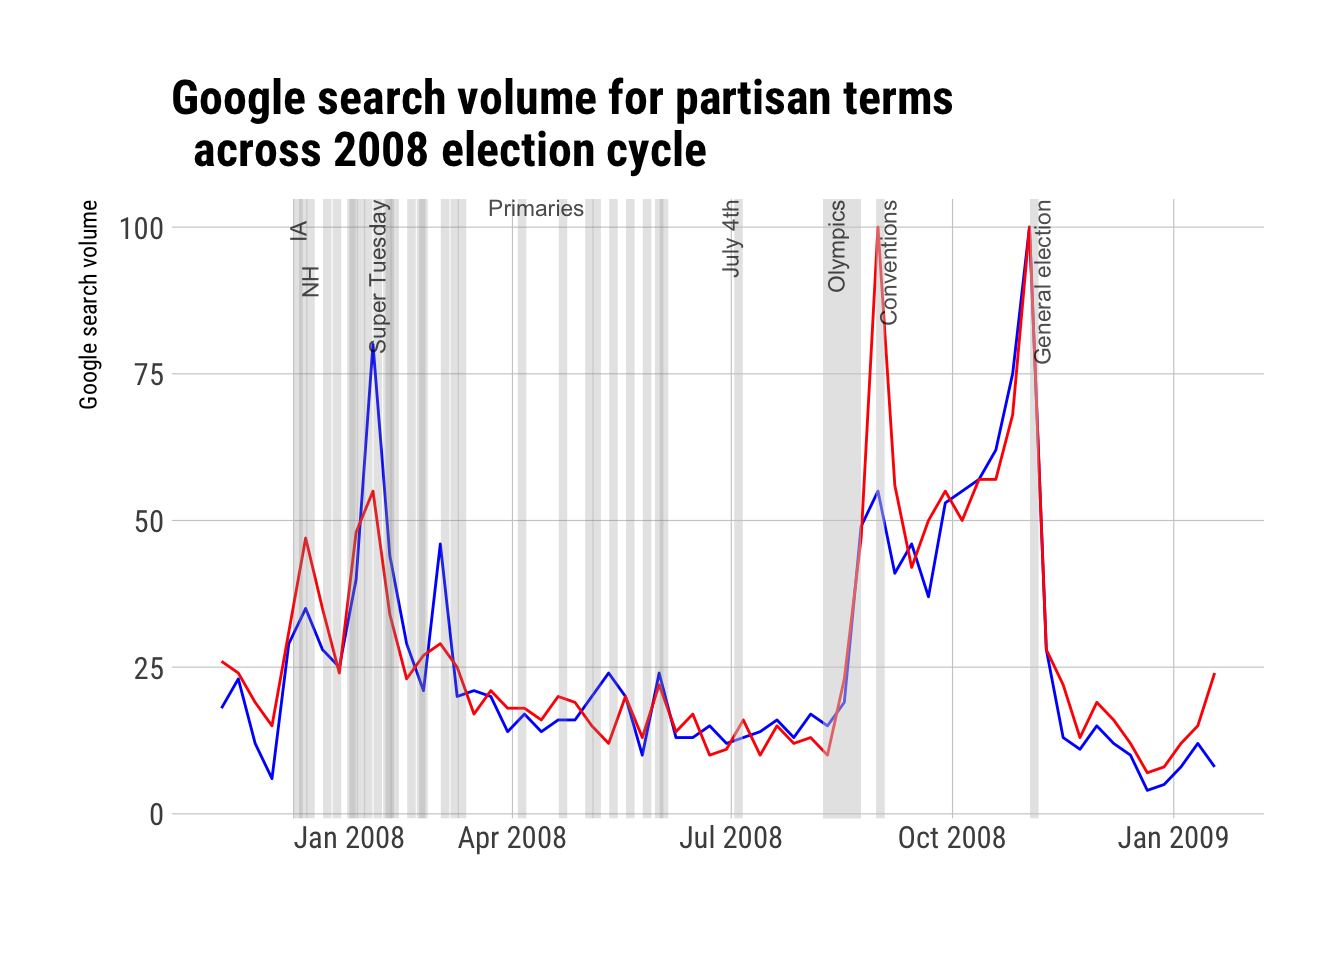
Here’s what I like about Google searches: it doesn’t tell us what the news is paying attention to, it’s an actual record of what people are searching for themselves. We can expect daily newspapers and cable news channels to cover politics every day, but the average person may not. These charts show, for 2004 and 2008, the relative number of times Google users searched for Democrat/Democrats (in Blue) and Republican/Republicans (in Red). One thing to note: the scale on the y axis goes from 0 to 100, but 100 just refers to the maximum search volume recorded in a given week, for that term - not actual absolute numbers of searches. But this caveat aside, the data shows pretty much exactly what we would expect if it were measuring political attention.
Specifically:
- We can see peaks in attention around Super Tuesday, Conventions and the general election.
- Attention is consistently low during the summer lull in the political cycle, between primaries and party conventions.
- Attention is particularly high in Super Tuesday of 2008 when there were many more primaries concentrated on one day than in other election years.
- The party conventions in 2004 were on different days and the search patterns reflect this.